


Skip to content

Data Engineering & AnalysisData analytics consulting that turns business data into decisions.

Data analytics consulting brings the data from your separate systems together, checks its quality and builds the reports your team decides from. We build the pipelines, one agreed definition for each metric, and the dashboards and analysis on top, starting with a 2 to 3 week data assessment that ends in a prioritized plan. It fits a business whose finance, operations and sales systems report different numbers for the same month.

Packages

Start with a package

Four packages, each with its price on the page. Pick one and buy it online.

Billing

What you get

What you walk away with.

  1. Versioned, tested pipelines with lineage
  2. Warehouse schema with a data dictionary
  3. Metric layer defined in code
  4. Data quality monitors with named owners
  5. Dashboards for key decisions only
  6. Cost and freshness targets per pipeline

Sounds like

You might recognize one of these.

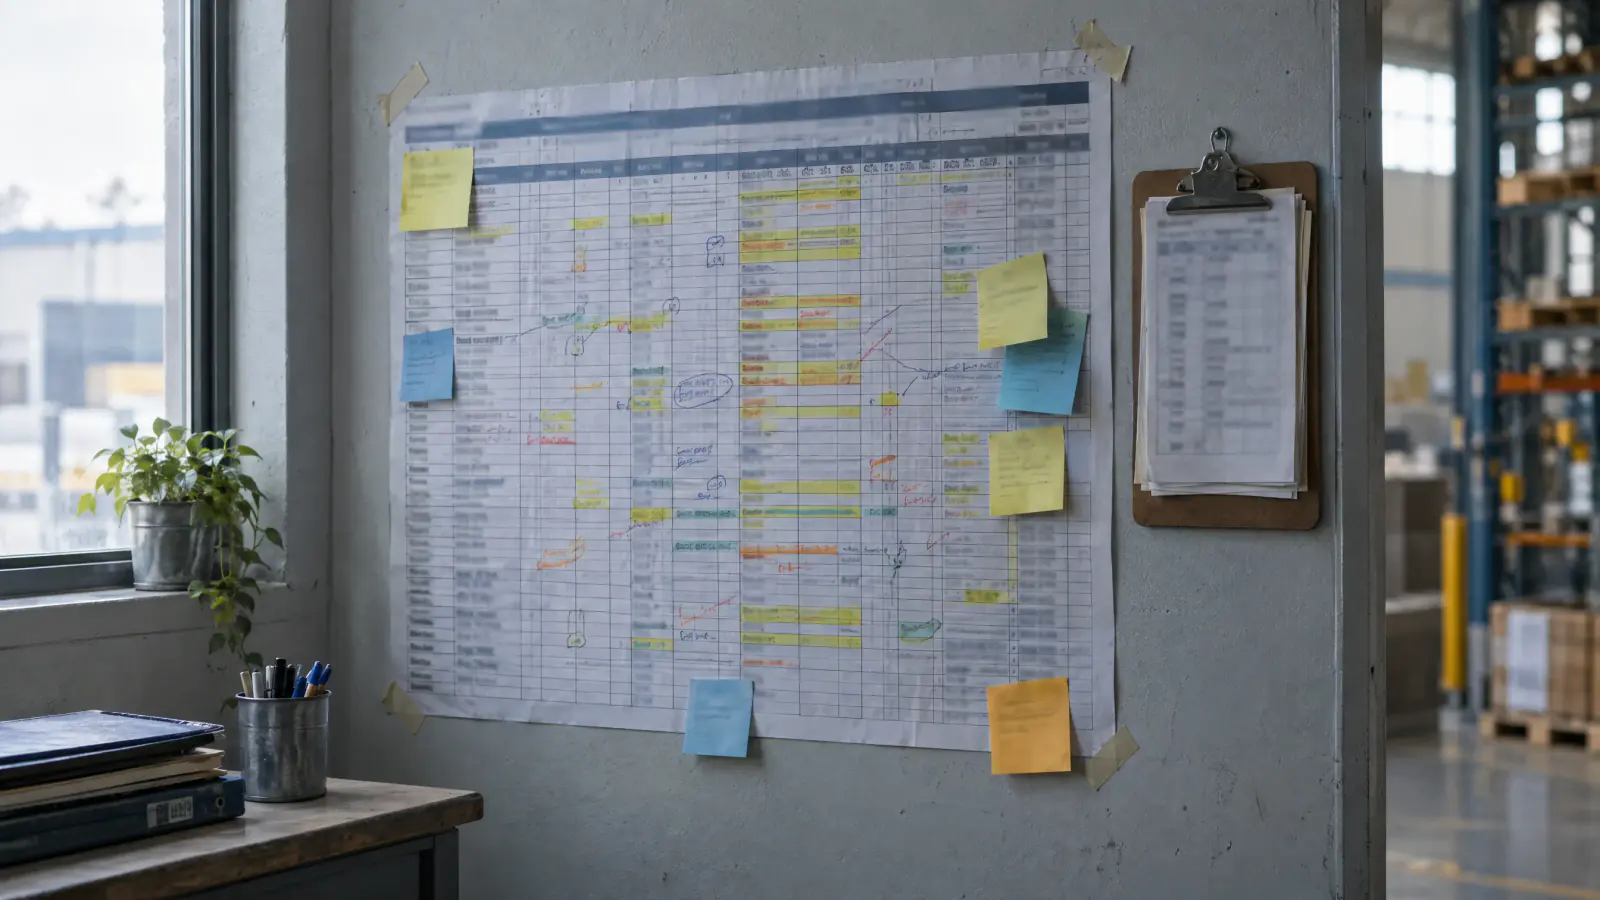
  • Finance and ops report different numbers for the same month.

  • Our reports run overnight and are wrong by morning.

  • Every question takes an analyst three days.

  • We bought a BI tool and it changed nothing.

How it runs

Phases and timing.

  1. 2–3 weeks

    Data assessment

    Source inventory, definition conflicts, quality baseline and a prioritized plan, including which reports to delete.

  2. 8–14 weeks

    Warehouse foundation

    Ingestion, core models, the first set of governed metrics and the quality framework around them.

  3. Ongoing

    Analytics enablement

    New domains, self-service enablement and embedded analytics inside your own products.

The detail

What the scope includes.

Data Engineering and Analysis

We review your data sources and agree what the analysis needs to answer. We then combine, clean and organize the data, analyze it and report the findings.

More about Data Engineering and Analysis
Aggregation
Combining data from separate systems, such as sales, marketing and performance reports
Visualization
Presenting findings in dashboards, charts and presentations for your team, investors or clients
Business insights
Comparing results from business strategies, marketing campaigns or training programs

When this service fits

  • You want to know what improvements your data says you should make
  • You want to see how well a strategy is working
  • You want to understand a critical part of your business, such as a new customer base
  • You want to design effective KPIs for your business
  • You want to see your progress in clear, meaningful numbers

Show all 5 parts of the scope
  • Ingestion and change data capture

    Incremental extraction from databases, SaaS APIs, flat files and EDI feeds, with schema-drift detection and replay after failure.

  • Warehouse and lakehouse modeling

    Dimensional models for the questions your business asks, with tested transformations, documented lineage and enforced data contracts.

  • Semantic layer

    Metrics defined once, in version control, and used identically by the BI tool, the API and the spreadsheet. It ends the three-numbers meeting.

  • Data quality and observability

    Freshness, volume and referential tests on every load, with alerts routed to an owner, not a shared inbox.

  • Operational analytics

    Insight delivered inside the systems where work happens, such as a reorder point in the purchasing screen, not only a dashboard.

Show the tools we use
Warehouses
  • Snowflake
  • BigQuery
  • Databricks
  • PostgreSQL
  • ClickHouse
Transformation
  • dbt
  • SQLMesh
  • Spark
  • Airflow
  • Dagster
Ingestion
  • Debezium
  • Fivetran
  • Airbyte
  • Kafka
  • EDI/X12
Consumption
  • Power BI
  • Looker
  • Metabase
  • Evidence
  • Embedded APIs

Questions

Common questions.

  • Versioned, tested pipelines with lineage, a warehouse schema with a data dictionary, a metric layer defined in code, data quality monitors with named owners, dashboards for key decisions only, and cost and freshness targets per pipeline. It starts with a 2 to 3 week data assessment that ends in a prioritized plan.

  • Yes, and the first step is the same at any size: a 2 to 3 week data assessment covering your sources, where definitions conflict and a quality baseline, with a plan that includes which reports to delete. If your existing database is enough, we say so instead of selling a warehouse.

  • A BI tool displays numbers; consulting settles what the numbers mean. We define each metric once, in version control, so the BI tool, the API and the spreadsheet return the same figure, and the tool you already own can stay.

  • If reporting queries are slowing your transactional system, or answers require joining more than one source, you need somewhere else to do the work. Below that threshold a read replica and good indexes are cheaper and we’ll say so.

  • Yes. The tool is rarely the problem. We’ve delivered against Power BI, Looker, Tableau, Metabase and plain SQL, and the semantic layer means the choice stops being permanent.

  • Classification at ingest, column-level masking, role-based access enforced in the warehouse, and region-pinned storage where regulation requires it. Access is reviewable and logged.

The other practices

Where this practice stops, and who picks it up.

Software that runs a business process: the application, the data behind it, and the integrations that keep it fed.

Next step

Tell us what’s breaking.

Forty-five minutes, no charge. We’ll say what we’d do, what it would likely cost, and whether what you already have can be made to work.

Reply
A person replies, not a sequence: within one business day, from someone who would be on the engagement.